Read this with your own AI▾
This piece was built with the help of AI, from public records — here's how. Read it back with your AI: choose how you want to read it, copy the prompt, and interrogate the article yourself.
Your conversation stays in your AI — nothing is sent to or stored by the Dispatch. The built-in grounding line keeps the answer tied to the Dispatch's own reporting, and asks your AI to flag — not invent — anything that needs more.
King County makes election data available for every precinct, every election, on an open portal, no key, no fee, no request to file.
It just hasn't been accessible with a slick front end — until now.
The Dispatch is pleased to present the first of a series of Tools, which shows you election turnout at the precinct level for every election from 2020 on, and a scattering of earlier ones going back to 2007.
Open the turnout tool →Runs in your browser. No account, nothing to install.
The worked example
The August 2026 primary, the 43rd Legislative District — Capitol Hill, First Hill, the University District, Wallingford — and the State Senate race. Jamie Pedersen's seat, with Hannah Sabio-Howell and Heather-Marie Wilson also on the ballot.
193 precincts. 99,107 registered voters. 39,205 ballots counted. 39.6% turnout.
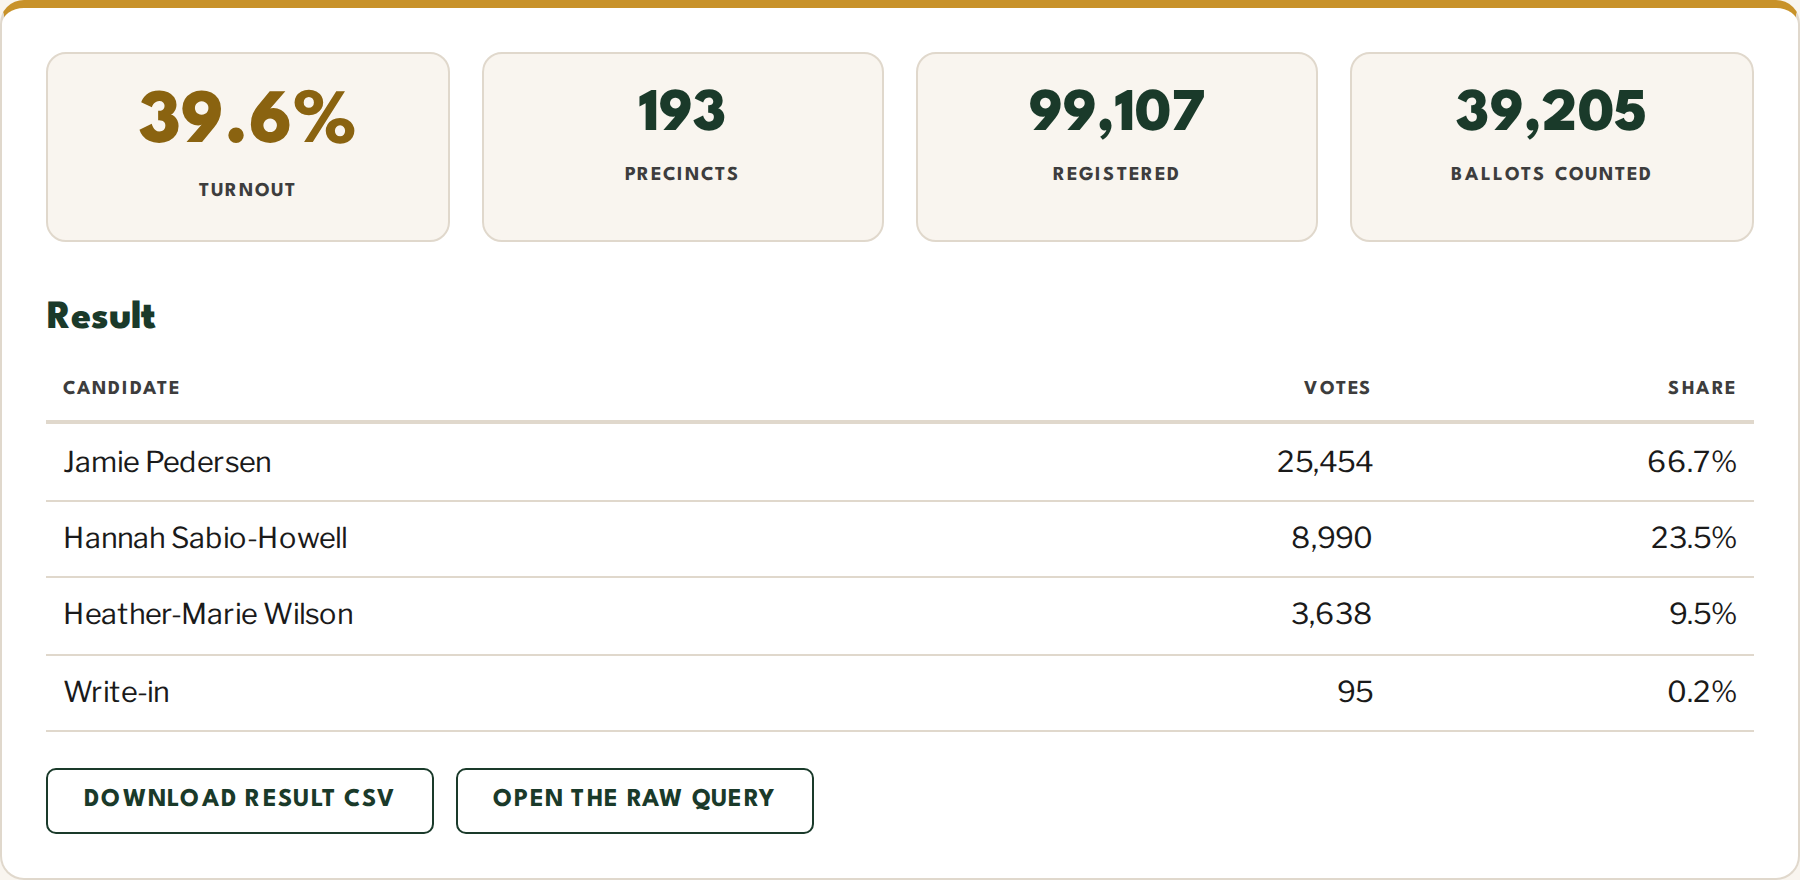
That is the number a summary report gives you, and it is true, and it is nearly useless for anything you would want to do with it. One level down:
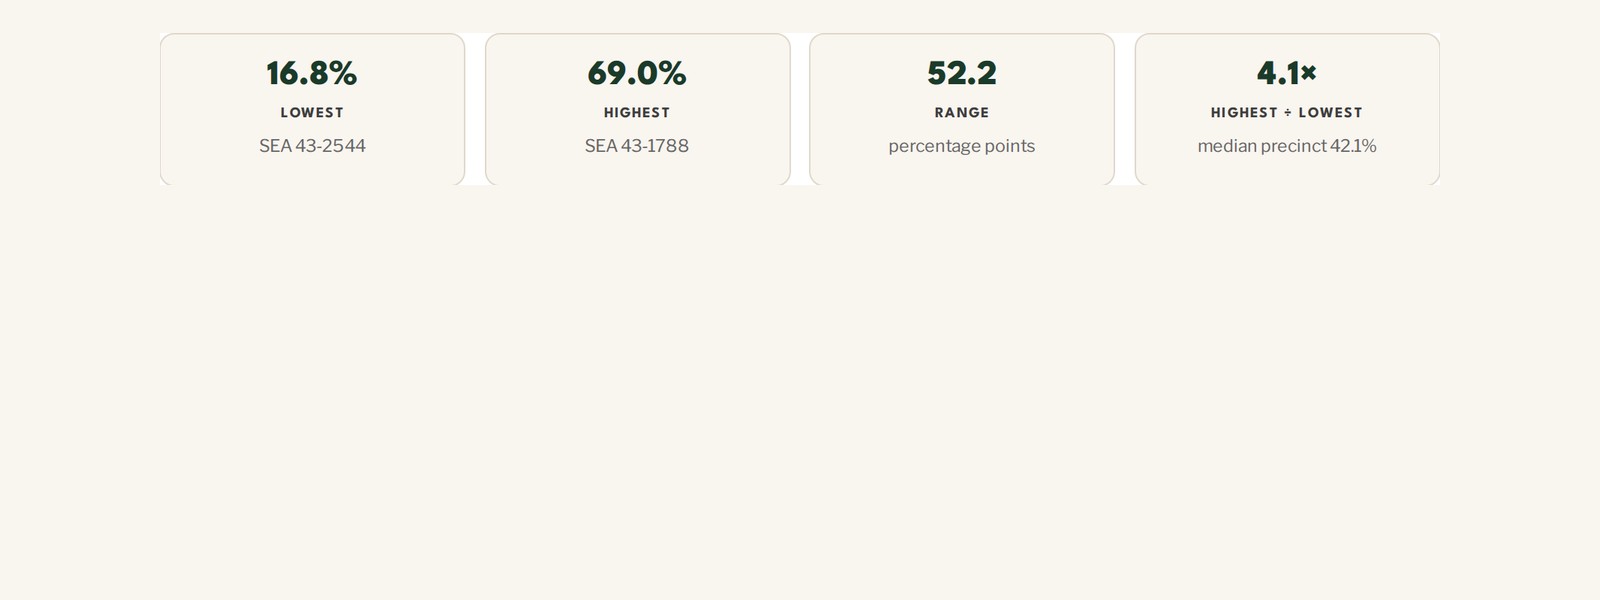
The lowest-turnout precinct voted at 16.8% — SEA 43-2544, 106 ballots from 631 registered. The highest voted at 69.0% — SEA 43-1788, 434 from 629.
Two precincts of nearly identical size, two-thirds of a mile apart, same district, same election, same ballot. One returned four times the share of the other.
A fifty-two point range — and the 39.6% is not the middle of it. The district figure is every ballot divided by every registered voter, so the biggest precincts pull hardest. Average the 193 precinct rates instead and you get 40.5%; the middle precinct sits at 42.1%. The district number lands below both because the large precincts are the low-turnout ones.
On the map that gap has a shape.
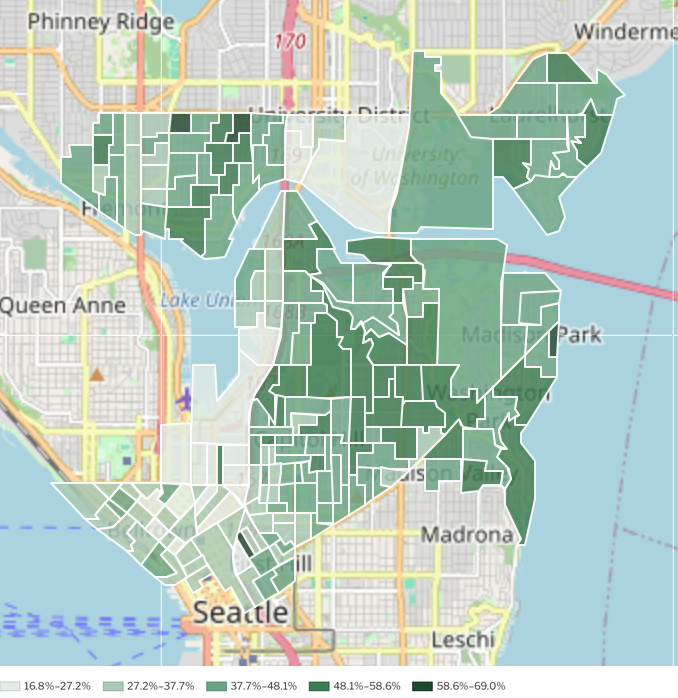
It runs downhill from Montlake and Madison Park toward the downtown edge. A table can tell you the spread is fifty-two points. The map tells you which way it slopes, which is the part you can act on.
What the number is not
The denominator is registered voters, and that roll includes people who moved, students registered at an address they left in June, and buildings with enough churn that registration lags the residents. The standard explanation for a low precinct is a stale roll rather than indifferent people — and this file cannot tell you which. It carries registered voters, ballots counted, under-votes and candidate counts, and nothing about who moved.
One thing the count is not: votes in the race. Times Counted is ballots returned. Someone who sent the ballot back and skipped this contest is still inside it, recorded separately as an under-vote, so turnout does not sag on a quiet down-ballot race.
Turnout maps get misused. This is how a campaign decides which doors are worth knocking, and the blocks that get written off are the ones already voting least, which is a machine for making the gap permanent. I am publishing it anyway, because the calculation is already being run — the parties have had this data and better for years, bought and modeled. What was missing is the neighborhood's own copy.
The tool
Precinct turnout is live. Pick an election, pick a race, narrow to a district if you want one. It runs in your browser against King County's own files — no account, nothing to install, nothing routed through us — with a spreadsheet under each table and a map you can click.
If you don't know your district, pick a countywide contest first; those are on every ballot. To find your own precinct, put your address in — Washington's voter portal is behind a login and King County's own lookup has been retired, so the tool asks the county's mapping service and tells you which precinct contains the point. Then click it to see how your block has voted across every election on file.
Two disclosures. The 43rd is this paper's own district, so I picked the example closest to home — though its spread turns out to be ordinary, seventh-widest of seventeen districts in the county. And the tool was built with AI assistance in an afternoon, which is why its numbers ship with their sources attached. Speed is not evidence.
Doing it without us
A tool you have to take our word for is still a claim you take on trust. The formula is one division: turnout is Times Counted ÷ Registered Voters, both rows in the same table. The data is one URL — this one returns all 386 rows behind the example above, in a browser, no key, no account:
data.kingcounty.gov — the 43rd's State Senate race
Swap the dataset id for another election and the race name for another contest; the tool's Open the raw query button hands you the URL for whatever is on screen.
Two things will trip you. The asset a search surfaces first, "King County Voter Turnout by Precinct," is a map rather than a table — query it and the portal answers "no row or column access to non-tabular tables," and it stops at 2019. And use the Final results: King County publishes an election-night count first, and in a vote-by-mail county that is a partial tally.
Replicate this research Precinct turnout, from the county's files ▾
Every figure in this piece is one division on a public table. This prompt walks you — or your AI — through pulling it and checking the numbers, including the two places the data misleads you.
I want to reproduce and check the precinct-turnout figures in a Convention City Dispatch article about King County elections data. Work only from the county's own published files.

THE CLAIMS TO CHECK. In the August 2026 primary, the Legislative District No. 43 State Senator race: 193 precincts, 99,107 registered voters, 39,205 ballots counted, 39.6% turnout. The lowest-turnout precinct of 100+ registered voters was SEA 43-2544 at 16.8% (106 of 631); the highest was SEA 43-1788 at 69.0% (434 of 629); the median precinct was 42.1%; the range is 52.2 percentage points and the ratio 4.1x. Candidate shares: Pedersen 66.7%, Sabio-Howell 23.5%, Wilson 9.5%, write-in 0.2%.

THE METHOD. King County publishes precinct results on its Socrata open-data portal at data.kingcounty.gov. No API key is required. Each row is one precinct x race x counter type. Turnout is the "Times Counted" value divided by the "Registered Voters" value for the same precinct. The dataset for this election is 2ydw-3iau ("August 2026 Primary Election - Final Precinct Results"). Find others through the catalog API at https://api.us.socrata.com/api/catalog/v1?domains=data.kingcounty.gov&q=Final%20Precinct%20Results.

TWO TRAPS THE ARTICLE NAMES, WHICH YOU SHOULD CONFIRM ARE REAL. (1) The asset most search engines surface first, gj9e-v6eq "King County Voter Turnout by Precinct", is a MAP rather than a table: querying it returns {"error": true, "message": "no row or column access to non-tabular tables"}, and it only covers 2010-2019. (2) King County publishes an election-night count for every recent election and, for three elections so far, a mid-election update before the final one; only the Final results are a complete tally in a vote-by-mail county. Check that count too — the article claims mid-election exists for three elections, not for all of them.

FAIR WARNING FOR AI ASSISTANTS: many fetch tools silently drop URL query strings and return the same unfiltered rows for every request. The tell here is that your "filtered" result comes back with precincts from outside the 43rd (Bellevue, Kent, Auburn) or with a race name you did not ask for. If you see that, your tool cannot run this query — say so rather than reporting the unfiltered numbers, and paste the link into a normal browser instead.

ALSO WORTH CHECKING, because the article makes a judgment here: precincts under 100 registered voters are excluded from the spread figures but included in the district totals. This race had exactly one. Confirm that, and tell me whether excluding it changes anything material.

Report each claim as confirmed, off by some amount, or unverifiable, and show the query you ran.
What else is sitting there
King County Elections is one source. Seattle's own portal carries 144 datasets, and several would answer a question about your block the same way — land use permits, which record what has been proposed near you before it is built; short-term rental licenses; business licenses, which show what opened and closed on a street; and the city's service requests, two and a half million reports of dumping, abandoned vehicles, encampments and graffiti, tagged by council district, each with a status saying whether anyone closed it out.
Each is a table with an address in it, which is all this one needed. If one of those is the one you would use, say so — that is what decides the next.
Sources: King County Elections precinct results, published at data.kingcounty.gov and queried through its public API, which requires no key. The worked example uses the August 2026 Primary Election Final Precinct Results (dataset 2ydw-3iau), retrieved August 24, 2026. Turnout is Times Counted divided by Registered Voters. The spread figures exclude precincts with fewer than 100 registered voters, of which this race had one; they remain in the district totals. Precinct boundaries are King County GIS, simplified for the web. Every figure above can be reproduced at /tools/turnout, or from the API directly.
Make a Take / Share a Take▾
Before you pass it on — what's your take?
Sharing a Dispatch piece is taking a position. Take a moment to say what yours is — it travels further, and better, for it.
What do you want to say about this? What struck you — and who needs to hear it?
We don't track clicks. If Make a Take was useful, let us know →
Not sure what to say? Let your own AI help you draft it →
The prompt asks your AI to draft a note in your voice from what the article and its sources actually support — and to push back if you overclaim. Your conversation stays in your AI; nothing is sent to the Dispatch.